
At Gravity Jack we’re committed to creating the future experience, and are bullish on virtual reality (VR)! Anyone who’s had the chance to use a modern VR device such as the HTC Vive knows that VR is a powerful and transformative medium. The fields that VR can transform include gaming, travel, real estate, entertainment and more! A more abstract use case is data visualization. We live in an age of ever-expanding data, and visualization is increasingly important for making sense of, and building intuition for, such a large amount of information. VR offers a whole new medium for data explorations and has the capability to go beyond visualizations to immersive experiences. This is an exciting time for VR content creators such as us, because there’s an opportunity to invent entirely new user interfaces and user experiences. Some examples of early efforts at applying VR to data visualizations include a roller-coaster like experience of the Nasdaq, published by the Wall Street Journal and a tour through England, using three-dimensional structures to communicate the ranking of each town in a simulated data set.
At Gravity Jack one of our main development platforms is the Unity game engine, and Unity has well-developed tools for building VR content and interfacing with hardware like the HTC Vive. An alternative for creating VR content is to take advantage of VR tools built on top of the WebGL standard. WebVR is convenient because there is less overhead involved in getting started with development. Additionally, until there is wide-spread utilization of dedicated VR headsets, developing for the browser gives more people the chance to experience it. The biggest downside of this approach is the lack of native inputs which makes UI significantly more challenging. One way of dealing with that is to give the user a kind of guided tour around the data, which is the approach of the WSJ Nasdaq visualization, among others.
This post describes building a virtual reality data visualization using Three.js, a framework for developing WebGL content. There are a number of tutorials available to cover the basics of Three.js so I will focus on the aspects unique to this particular VR data visualization. In the world of open-source javascript, code changes rapidly, so it’s important to note that this was built with release 78 of Three.js. The source code is available on the Gravity Jack github. The final result can be viewed at, http://vr-data-vis.herokuapp.com/engsoccerdata/index.html and below is a preview of what it looks like:
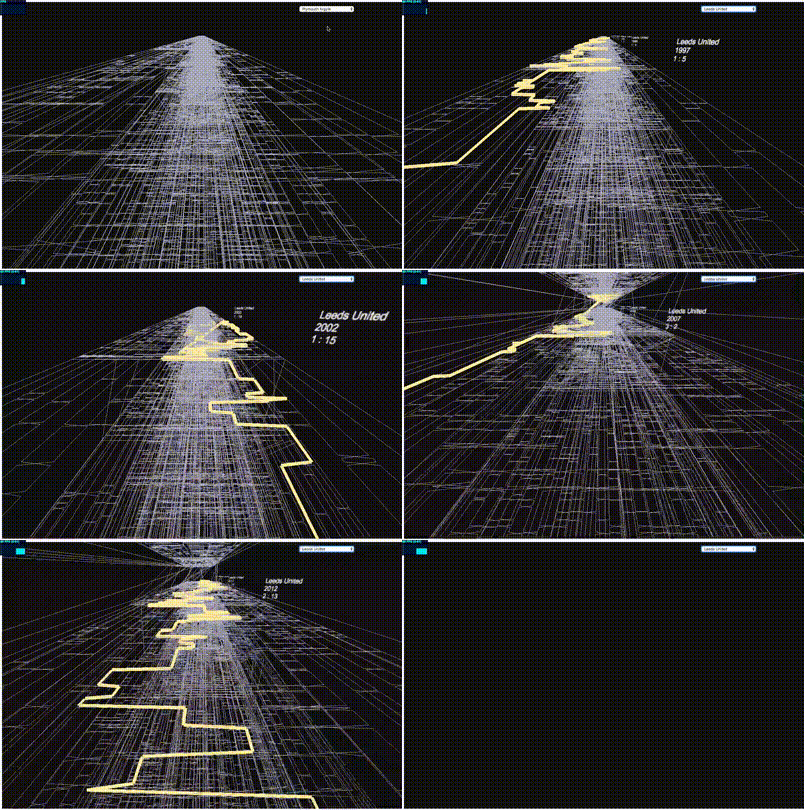
The data set I am working with is a history of English and European soccer results, provided in the engsoccerdata package for the R programming language. The source code for that is available on github at jalapic/engsoccerdata. With a short R script, provided in the github link, one can compute the cumulative standings for each team in the data set. Although the data go back to the late 1800’s, for this project I focused on the English league, starting from 1995. The starting point for the visualization is the ordinal rank of a team within its league as a function of time. This layout is known as a bump chart. One classic example that highlights the use of bump charts is the beautiful representation of the population of U.S. cities from 1790-1890, by Henry Gannet, published as part of the analysis of the 1890 U.S. census. The English soccer data is particularly amenable to a VR visualization because the concept of relegations and promotions in English soccer naturally introduce the concept of tiered data.
The visualization follows the general approach of the WSJ Nasdaq roller coaster visualization, where the user is taken on a tour of the data, but has the substantive difference that the data are laid out in tiers.
As with all Three.js projects, we begin by defining a scene, a camera, and a rendering context.
var canvasWidth = 1200, canvasHeight = 800;
var scene = new THREE.Scene();
var camera = new THREE.PerspectiveCamera(75, canvasWidth / canvasHeight, 0.1, 100000 );

var renderer = new THREE.WebGLRenderer();
renderer.setSize( canvasWidth, canvasHeight );
renderer.setClearColor( 0x111111, 1);

document.body.appendChild( renderer.domElement );
For this example we’d like to offset the camera from the origin of the world coordinate system by raising it up (the positive y direction) and tilting it down (negative, around the x axis) to view the rendered data.
camera.position.y = 20;
camera.position.z = 0;
camera.rotation.x = -30 * Math.PI/180;
To translate the data to world coordinates, we use the scales functionality from the d3.js javascript library
var distanceBetweenTiers = 200;
var verticalScale = d3.scalePow()
   .domain([1, 4])
   .rangeRound([0, -distanceBetweenTiers]);

var rankScale = d3.scalePow()
   .domain([1, 24])
   .rangeRound([0, 23*5]);
The mapping of the time variable to world space is more complicated because it depends on two variables – year and day – so I use a custom function to define a simple linear conversion
var timeScale = function(season, day) {
   return -(300 * (+season - 1995) + day);
};
The data are read from a JSON file and have the structure
data = {teamName: [{season: , currentday: , tier:, rank: }]} where rank is the ordinal rank, as a function of time. The variable currentday runs from 0 at the beginning of the season, through 250 or so at the end of the season.
For each time, a trajectory is built by iterating over the data for each individual team, defining a line segment from the old position vector (vxold, vyold, vzold) to the current position vector (vx, vy, vz), and then pushing the coordinates onto the vertices attribute of the Geometry object, lg,
allTeams.forEach(function(k) {
 var vxold, vyold, vzold;
 data[k].forEach(function(d, i) {
 vx = rankScale(+d.Pos);
 vy = verticalScale(d.tier);
 vz = timeScale(d.Season, d.currentday);
  if (i === 0) {
vxold = vx;
vyold = vy;
vzold = vz;
return;
  }

 var lineSegment =
     new THREE.LineCurve3(
         new THREE.Vector3(vxold, vyold, vzold),
         new THREE.Vector3(vx, vy, vz)
     );
// are we transitioning between tiers?
   if (Math.abs(vy - vyold) > 1e-2) {
       nsamples = 256;
   } else {
       nsamples = 2;
   }

   var pointsArray = lineSegment.getPoints(nsamples);
   pointsArray.forEach(function(p) {
       lg.vertices.push(
           new THREE.Vector3(p.x, p.y, p.z)
       );
   });

   vxold = vx;
   vyold = vy;
   vzold = vz;
 }

 lineGeometries[k] = lg;
 var line = new THREE.Line( lg, lineMaterial );
 mergeGeometry.merge(line.geometry, line.matrix);
}
An interesting wrinkle here is that we change the sampling depending on whether the trajectory is contained in the x-z plane corresponding to a particular tier or whether we are transitioning from one tier to another. As we’ll see later, the camera follows these trajectories, and this is a way of smoothing the transitions between tiers so that they don’t happen too abruptly. In the final step we add the newly created Line object to the mergeGeometry object. Combing the geometries this way reduces the number of draw calls and is important for performance.
To allow user input about which team they would like to focus on, we use an html select input. In the index.html file we have a tag like this, <select id="teamSelect"></select>
then, in javascript we fill the options and define an onchange callback
selectBox = document.getElementById("teamSelect");
selectBox.style.position = 'fixed';
selectBox.style.width = 100;
selectBox.style.height = 100;
selectBox.style.backgroundColor = "white";
selectBox.innerHTML = "placeholder";
selectBox.style.top = 20 + 'px';
selectBox.style.left = 900 + 'px';

allTeams.forEach(function(team) {
   var option = document.createElement("option");
   option.text = team;
   option.value = team;
   selectBox.add(option);
})

$(document).on('change', '#teamSelect', function(e) {
 var selectedTeam = this.options[e.target.selectedIndex].text;
 onTeamSelectChange(selectedTeam);
});
Finally we create a mesh from the merged geometry, add it to our scene, and call the render method of our renderer,
var mergeMesh = new THREE.Line(mergeGeometry, lineMaterial);
scene.add( mergeMesh );
renderer.render(scene, camera);
The onTeamSelectChange function calls the main loop which highlights the line belonging to the current selected team and defines the camera trajectory,
var time_resolution = 10;
var frame_resolution = 1;
var cameraVerticalOffset = 0.1 * distanceBetweenTiers;
var time_start = Date.now();
   var coloredLineMaterial = new THREE.LineBasicMaterial({
       color: 0xffeda0,
       linewidth: 10
   });
function main(theTeam) {
// remove highlighting if it already exists
   if (highlightedLine) {
       var g = highlightedLine.geometry;
       var m = highlightedLine.material;
       scene.remove(highlightedLine);
       g.dispose();
       m.dispose();
   }

   lineGeometry = lineGeometries[theTeam];
   cameraTrack = [];

   for(var i=0; i<lineGeometry.vertices.length; i += time_resolution) {
       if (i + time_resolution < lineGeometry.vertices.length) {
           var dy = lineGeometry.vertices[i+time_resolution].y - lineGeometry.vertices[i].y;
       } else {
           var dy = 0.0;
       }

       if ( Math.abs(dy) > 1e-2) {
           for (var j = 0; j < time_resolution; j++ ) {
               v = lineGeometry.vertices[i + j];
           }
       } else {
           v = lineGeometry.vertices[i];
       }
       cameraTrack.push(new THREE.Vector3(v.x, v.y + cameraVerticalOffset, v.z));
   }
// highlight the currently selected team
   highlightedLine = new THREE.Line(lineGeometry, coloredLineMaterial);
   scene.add(highlightedLine);

   var idx = 0;
   var frameCount = 0;
   function render() {
       time = (Date.now() - time_start)/1000;
       if (frameCount % frame_resolution === 0) {
           var v = cameraTrack[idx];
           camera.position.z = v.z;
           camera.position.y = v.y + 10;
           idx += 1;
       }
       frameCount += 1;
       renderer.render(scene, camera);
   }

   function animate() {
       requestAnimationFrame(animate);
       if (useControls) {
           controls.update();
       }
       render();
       stats.update();
   }

   animate();
}

